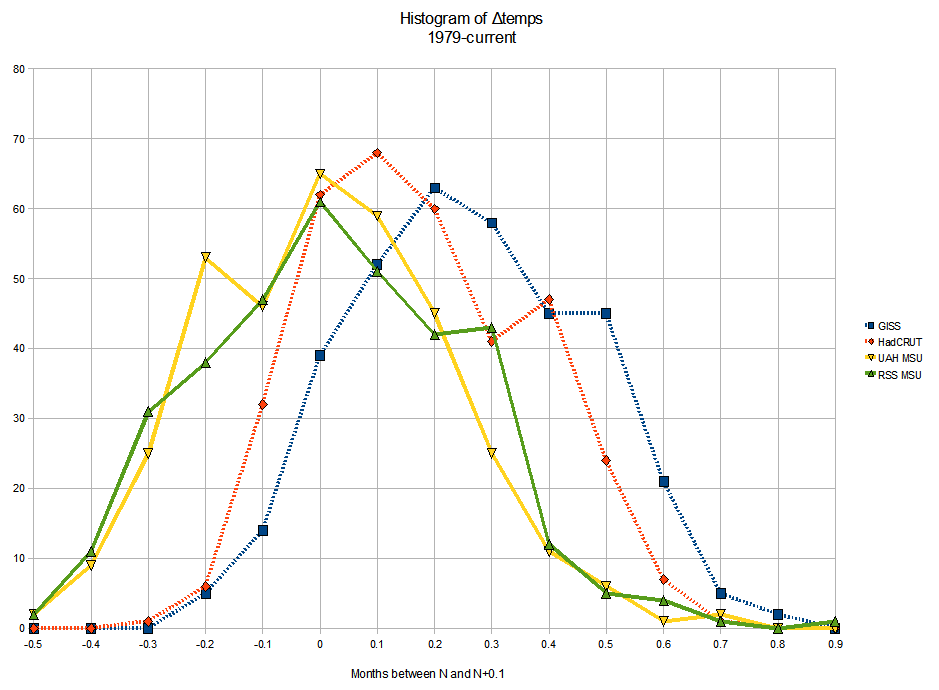
| N<m≤(N+0.1) | GISS | HadCRUT | UAH MSU | RSS MSU |
| -0.5 | 0 | 0 | 2 | 2 |
| -0.4 | 0 | 0 | 9 | 11 |
| -0.3 | 0 | 1 | 25 | 31 |
| -0.2 | 5 | 6 | 53 | 38 |
| -0.1 | 14 | 32 | 46 | 47 |
| 0 | 39 | 62 | 65 | 61 |
| 0.1 | 52 | 68 | 59 | 51 |
| 0.2 | 63 | 60 | 45 | 42 |
| 0.3 | 58 | 41 | 25 | 43 |
| 0.4 | 45 | 47 | 11 | 12 |
| 0.5 | 45 | 24 | 6 | 5 |
| 0.6 | 21 | 7 | 1 | 4 |
| 0.7 | 5 | 1 | 2 | 1 |
| 0.8 | 2 | 0 | 0 | 0 |
| 0.9 | 0 | 0 | 0 | 1 |
| GISS | HadCRUT | UAH MSU | RSS MSU | |
| Max | 0.87 | 0.75 | 0.77 | 0.9 |
| Min | -0.18 | -0.3 | -0.49 | -0.49 |
| Avg | 0.32 | 0.23 | 0.07 | 0.08 |
| StdDev | 0.2 | 0.19 | 0.21 | 0.23 |