L'Ombre de l'Olivier

The Shadow of the Olive Tree

being the maunderings of an Englishman on the Côte d'Azur

29 October 2008 Blog Home : October 2008 : Permalink

Urban Heat Islands in Reno

Over at WattsUPWithThat there have been two recent posts (with lots of comments) concerning the effect of Urban Heat Islands (UHIs). The reason for this is an amazingly dismissive statement about UHIs in this piece of global warming alarmism. The statement is the following sidebar:

Is Urbanization Causing the Rise in Temperatures?

The few remaining global warming contrarians, many of whom have directs links to the fossil fuel industry, have argued that urban “heat islands”—where the air temperature is several degrees warmer than surrounding rural areas—may be responsible for a substantial portion of the average temperature increase linked to global warming. Compared with rural areas, urban areas have more dark surfaces (such as pavement) that absorb heat from the sun and less vegetation to provide shade and cool the air. Because these urban heat islands raise nighttime temperatures more than daytime temperatures compared with non-urban areas, some have argued that urbanization is to blame for data indicating rising global temperatures.

Several studies have shown,however, that the urban heat island effect has minimal impact on rising global temperatures. In a 1997 study, David Easterling of the National Climatic Data Center examined data from 5,400 weather stations, of which 1,300 were located in urban areas. He found that urban effects on globally averaged temperature data were “negligible” and did not exceed about 0.05°C over the period 1900-1990.58 These results confirm the conclusions of a similar 1990 study. David Parker of the UK’s Hadley Centre also found that global temperatures have risen as much on windy nights (when the urban heat island effect is diminished) as on calm nights (when the effect is at its strongest). He concluded that “overall warming is not a consequence of urban development.”

The tract then goes to list Reno Nevada as the station (in the ones sampled) with the second highest increase in temperature when comparing the period 2000-2007 with the period 1971-2000. The station in question is located at Reno airport which is (now) in the middle of the urban area but was not so located half a century ago.
There is quite a lot of possible arguing that can go on (and has done so) however the second post seems to provide pretty clear evidence that Reno now exhibits UHI effects. The question is whether or not it also exhibited these effects in the 1970s. One way we might be able to guess this is to look at population growth,

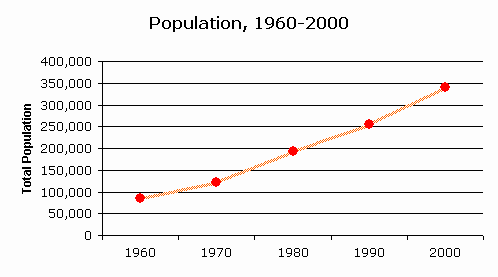
If we go to this site we have a nice graph showing Reno's growth from under 100,000 people in 1960 to about 350,000 in 2000
The image “http://www.censusscope.org/us/m6720/chart_popl_graph_1.gif” cannot be displayed, because it contains errors.
It seems pretty clear that Reno's population more than doubled during the perion 1970-2000 providing plenty of opportunity for UHI effects to grow in influence during the period.

So what do the temperatures look like? A commenter at the later WattsUpWithThat posts the following graph of temperature record from the GISS record for Reno compared with some other nearby but more rural locations

Reno, Tahoe City and other local stations
The reader is invited to note that the blue line increases considerably more than the others and that when compared to Tahoe City and Fallon Experimental Station the temperatures seem to show very much the same variations from year to year except that Reno increases.

I don't know whether the Reno increase is due to UHI or not but the facts are
  1. Currently Reno appears to show a UHI effect
  2. Reno's population has doubled over the last 40 years
  3. Reno's temperature compared to its neighbours has increased by c. 2°c
Occam's razor suggests that these facts are not unrelated